Jul 27, 2012
Strategy Bulletin Vol.75
Excessive U.S. consumption or excessive Chinese investments ? Which is the bigger problem?
The world needs to create more consumption
Completely different structural problems plague the world’s two largest economies: the United States and China. The United States has too much spending and China has too many investments. The general perception is that economic health is better in China, where investments account for a larger share of the economy. The U.S. economy is viewed as unsound. Furthermore, there is a common-sense view that these two excesses are supplementing each other to make the global imbalance even greater. However, this common-sense view is probably incorrect. In contrast to the commonly accepted view, the tendency for excessive consumption in the United States is actually a misunderstanding. Structural excesses in investments in China are the major problem. Too many investments in China will most likely give the U.S. economy a powerful presence once again while creating economic difficulties in China.
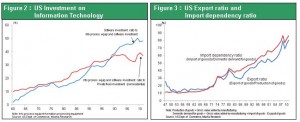
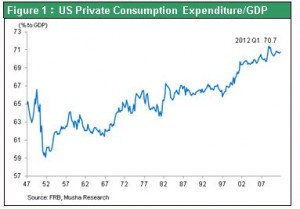 To illustrate this point, let’s look at how GDP is calculated. Information technology devices and software stayed between 10% and 20% as a percentage of total private-sector capital expenditures (non-residential) until the early 1980s. Now, this percentage is almost 40%. Clearly, IT-related capital expenditures account for a very large share of U.S. capital expenditures. Furthermore, software is currently about half of total IT-related capital expenditures compared with nothing before 1960. Now, this percentage is almost 50%. As you can see, although software investments have greatly increased as a share of GDP, the software investments that are incorporated in GDP are only a very small percentage of total expenditures. Purchases of software are generally treated as an immediate expense even though software is a cost for earning revenues in the future. Clearly, today’s methods used for accounting and statistics are unable to accurately measure the intellectual accumulation of assets in today’s IT-dependent society.
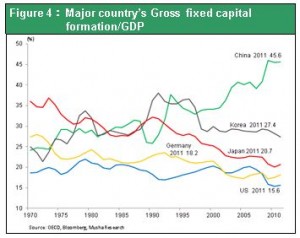
In industrialized countries, property and equipment is falling as a percentage of investments and the share of intellectual assets is rising. This problem with accounting and statistics obviously causes the statistical percentage of consumption to climb as this process takes place. A massive structural shift has taken place in the United States due to globalization, the hollowing out of industry, heavier emphasis on service and information-oriented industries and other trends. The result is that activities requiring brainpower have remained in the United States while activities requiring manpower have been moved overseas. As this shift occurred, export ratio, degree of dependence on import and consumption ratio of GDP rose significantly. As I stated in my previous report, this is the driving force behind the new business process reform revolution that originated in the United States. This explains why the structurally high volume of consumption that appears in U.S. statistics is not a sign of an impending decline of the United States. Instead, high consumption is an indication of the increasing importance of intellectually intensive activities in the United States.
Figure 2:US Investment on Information Technology
Figure 3:US Export ratio and Import dependency ratio
 At a turning point like this, desirable policy is that China should take actions to rapidly alter the distribution of income for the purpose of fueling a dramatic increase in consumption. China must eliminate its income disparity by raising labor’s share of income and allocating more income to agricultural villages and the service sector. In essence, this process entails shifting income from high-productivity sectors to low-productivity sectors like agricultural villages and the service sector. The primary channel for accomplishing this shift is inflation to raise prices of agricultural goods and services (inflation linked to the disparity in increases in productivity). In Japan, this type of inflation took place in 1960. This was the beginning of a correction in the income gap and powerful growth in domestic demand (the Lewisian turning point). Elimination of the surplus of agricultural workers during the 1960s caused Japan’s labor market to tighten (more than one job opening for each job seeker) and wages to climb at a double-digit pace. Since then, Japan’s consumer price index has consistently increased at an annual rate of more than 5% and there was a large increase in labor’s share of income. Income inequalities quickly disappeared and there was rapid growth in domestic demand. The result was economic growth centered on consumption.
However, these types of changes are not yet occurring in China. The consumer price index started to climb at one point but inflation has again dropped to the 2% level. Furthermore, there is no progress at all regarding correcting the allocation of income and eliminating income gaps. China is not creating spending power. That means the country has not yet passed the Lewisian turning point. Nevertheless, the Chinese government has responded to the rapid decline in economic growth that began in 2011 by attempting to boost the growth rate with a further increase in investments. Examples of these investments include the resumption of expressway projects that had been frozen, the start of steel mill construction despite a surplus of capacity in the steel industry and easing of restrictions on real estate investments. Taking these actions is very likely to result in the crime of making more excessive investments on top of past excessive investments. As a result, China will probably have to overcome significant challenges in order to achieve the necessary corrections in its economy.
Figure 5:China CPI
Figure 6:Japan CPI
(1) Why the explanation for excess U.S. consumption is a mistake
At first glance, it appears to be difficult to deny that U.S. consumption is too high. Private-sector consumption expenditures remained at approximately 60% in the United States following World War II. But this figure has exceeded 70% since 2000. A higher percentage for consumption immediately causes the investment percentage to fall. This is why the United States has been consistently criticized for overlooking investments and while doing nothing but spend money. However, a close look reveals that this is not an accurate assessment of the current situation. Progress with globalization at U.S. companies has reduced the amount of capital expenditures within the country. At the same time, U.S. companies have been increasing intellectual investments, such as investments in people to develop software. The result is the emergence of next-generation intellectual assets and the associated companies such as Apple, Google and Facebook. Expenditures for these newly increasing intellectual assets are seldom recognized by accounting rules as investments included in national income. For accounting purposes, investments produce assets that are capitalized and where expenses are recognized in the future. Very few intellectual expenditures can be capitalized. One example is the purchase of packaged software from external suppliers. As a result, the majority of these expenditures are treated as an expense or consumption. As business activities become more knowledge-intensive, the more the share of investments in education, technology development, software and other intellectual items grows, the more a company’s expenditures are treated as expenses. Investments in people do not remain on the balance sheet as assets. But this does remain as an invisible intellectual asset that is extremely valuable asset for a nation’s economy. Figure 1:US Private Consumption Expenditure/GDP To illustrate this point, let’s look at how GDP is calculated. Information technology devices and software stayed between 10% and 20% as a percentage of total private-sector capital expenditures (non-residential) until the early 1980s. Now, this percentage is almost 40%. Clearly, IT-related capital expenditures account for a very large share of U.S. capital expenditures. Furthermore, software is currently about half of total IT-related capital expenditures compared with nothing before 1960. Now, this percentage is almost 50%. As you can see, although software investments have greatly increased as a share of GDP, the software investments that are incorporated in GDP are only a very small percentage of total expenditures. Purchases of software are generally treated as an immediate expense even though software is a cost for earning revenues in the future. Clearly, today’s methods used for accounting and statistics are unable to accurately measure the intellectual accumulation of assets in today’s IT-dependent society.
In industrialized countries, property and equipment is falling as a percentage of investments and the share of intellectual assets is rising. This problem with accounting and statistics obviously causes the statistical percentage of consumption to climb as this process takes place. A massive structural shift has taken place in the United States due to globalization, the hollowing out of industry, heavier emphasis on service and information-oriented industries and other trends. The result is that activities requiring brainpower have remained in the United States while activities requiring manpower have been moved overseas. As this shift occurred, export ratio, degree of dependence on import and consumption ratio of GDP rose significantly. As I stated in my previous report, this is the driving force behind the new business process reform revolution that originated in the United States. This explains why the structurally high volume of consumption that appears in U.S. statistics is not a sign of an impending decline of the United States. Instead, high consumption is an indication of the increasing importance of intellectually intensive activities in the United States.
Figure 2:US Investment on Information Technology
Figure 3:US Export ratio and Import dependency ratio

(2) The problem with China's habit of making excessive investments
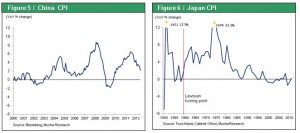
China, on the other hand, has an investment-driven economy of an unprecedented scale. First, over the past decade, investments and exports have accounted for 60% of China’s economic growth. Maintaining this level will be impossible. Furthermore, China’s fixed capital formation/GDP ratio was 46% in 2011, a level never before seen in any country. Investments have outpaced consumption in China at an accelerating pace since 2005. Once again, this cannot continue. Focusing resources on the creation of an economy driven by investments and exports can temporarily raise the economic growth rate (ability to supply goods). In fact, this phase of economic growth occurred in both Japan and South Korea. However, relying on this type of growth makes it very difficult to achieve a soft landing that results in sustainable growth in demand and an improvement in the standard of living. As I just explained, for economic statistics and accounting, investments are nothing more than expenditures that can be recognized as expenses in the future. One sure thing about investments is that there will be future expenses. But there is no certainty about receiving benefits from investments. This is why differences in expectations can cause a crisis. Large investments cause depreciation expenses and the capital coefficient to increase (worsening efficiency of capital expenditures). If investments fail to generate cash flows as expected, there is very likely to be an increase in non-performing assets. For instance, over a period of less than 10 years, China will make an enormous investment to construct an expressway network that is five times larger than the Shinkansen network in Japan. But now there are mounting concerns about these expressways becoming non-performing assets due to low utilization rates and doubts about safety. Figure 4:Major country’s Gross fixed capital formation/GDP At a turning point like this, desirable policy is that China should take actions to rapidly alter the distribution of income for the purpose of fueling a dramatic increase in consumption. China must eliminate its income disparity by raising labor’s share of income and allocating more income to agricultural villages and the service sector. In essence, this process entails shifting income from high-productivity sectors to low-productivity sectors like agricultural villages and the service sector. The primary channel for accomplishing this shift is inflation to raise prices of agricultural goods and services (inflation linked to the disparity in increases in productivity). In Japan, this type of inflation took place in 1960. This was the beginning of a correction in the income gap and powerful growth in domestic demand (the Lewisian turning point). Elimination of the surplus of agricultural workers during the 1960s caused Japan’s labor market to tighten (more than one job opening for each job seeker) and wages to climb at a double-digit pace. Since then, Japan’s consumer price index has consistently increased at an annual rate of more than 5% and there was a large increase in labor’s share of income. Income inequalities quickly disappeared and there was rapid growth in domestic demand. The result was economic growth centered on consumption.
However, these types of changes are not yet occurring in China. The consumer price index started to climb at one point but inflation has again dropped to the 2% level. Furthermore, there is no progress at all regarding correcting the allocation of income and eliminating income gaps. China is not creating spending power. That means the country has not yet passed the Lewisian turning point. Nevertheless, the Chinese government has responded to the rapid decline in economic growth that began in 2011 by attempting to boost the growth rate with a further increase in investments. Examples of these investments include the resumption of expressway projects that had been frozen, the start of steel mill construction despite a surplus of capacity in the steel industry and easing of restrictions on real estate investments. Taking these actions is very likely to result in the crime of making more excessive investments on top of past excessive investments. As a result, China will probably have to overcome significant challenges in order to achieve the necessary corrections in its economy.
Figure 5:China CPI
Figure 6:Japan CPI

(3) Using surplus labor and capital to create demand will begin with the United States
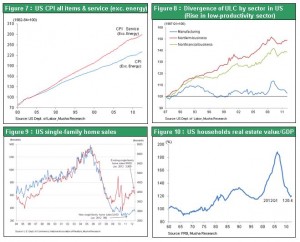
As I have explained, the perception of a U.S. “excessive consumption problem” is a mistake. Instead, the current structural excessive investments in China are an enormous problem. Excessive investments, which also mean inadequate consumption, are a problem not only in China but for the entire global economy. All of the world’s industrialized countries are now confronted by the same challenge: persistently high unemployment along with record-low interest rates. Another way to view this challenge is as the disease of surplus people and surplus capital. The fundamental cause of this problem is rising productivity backed by globalization and the Internet/cloud revolution. Companies can operate by using smaller amounts of capital and labor. The volume of surplus labor and capital is especially large in industrialized countries. There has also been a steep decline in the cost of equipment because of the IT/Internet technology revolution. In China and other emerging countries, surplus labor in the agricultural sector has been holding down wages. Cheaper labor has in turn produced extra earnings for companies that have been the source of surplus capital. These are basically positive events. Combining surplus capital and labor should create the potential of generating strong growth and a better standard of living. The problem is that outdated systems and restrictions, customs, resource and income allocations, and thinking create a barrier that separates capital and labor. In a sense, this is like having capital and labor on different shorelines that are separated by “troubled water.” Every industrialized country must figure out how to build a bridge to link capital and labor. The Great Depression of the 1930s is an example of the failure to achieve this link. Stock markets are watching closely to see if progress can be made this time. The United States has the greatest potential to become the driving force behind the global creation of demand. The conditions for this to happen have been coming together in one or two years. There are a number of outstanding conditions: (1) suitable and creative financial measures; (2) avoiding the fiscal cliff (I believe this can be done); (3) more progress with the new industrial revolution; and (4) a continuation in inflation linked to the gap in productivity gains (which means the income reallocation function is working). The bottoming out of the U.S. housing market, which is just now occurring, will probably be the starting point for this demand creation process. Figure 7:US CPI all items & service (exc. energy) Figure 8:Divergence of ULC by sector in US (Rise in low-productivity sector) Figure 9:US single-family home sales Figure 10:US households real estate value/GDP

