Oct 15, 2024
Strategy Bulletin Vol.366
Long-term asset price cycles and the risk of not owning Japanese stocks
~ Japanese stocks are more attractive than All Countries Index ~
(1) Asset Price Cycles or Super Bubble Cycles are Critically Important Now
Asset price cycles (bubble cycles) have never been more important for long-term asset allocation in international diversification than now. Each country has its own 10- to multi-decade cycle of rising and falling asset prices, and each country can buy at the bottom and sell at the top.
Fortunately, this asset price cycle has a completely different phase for each country, so international diversification should be based on the strength and weakness of this asset price cycle, rather than allocations based on a mechanical or static mathematical model. Country allocations should be allocated with the greatest emphasis on this long-term asset price cycle.
In particular, Japan is experiencing a rapid investment boom due to NISA, but the majority of this boom is flowing into overseas equity investment trusts, known as “All Countries” funds. Normally, there is a home-country bias, with an emphasis on investments in the home country, but in Japan, the opposite is happening, with an emphasis on overseas investments. This is quite irrational from the perspective of the phases of the asset price cycles of each country, which will be explained in detail below.
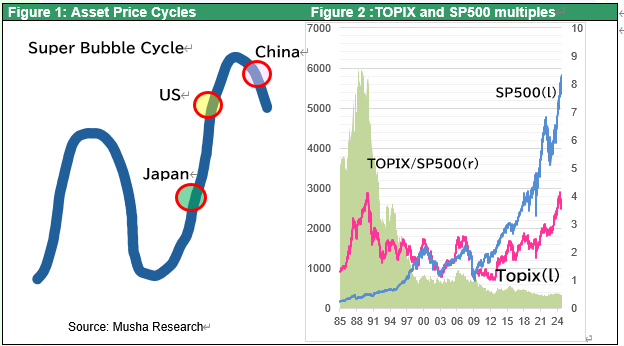
The asset price cycles of major countries are illustrated in Figure 1. China is just past the peak of the cycle and should curb asset investment and stick to the cash is King policy. In the U.S., asset prices are generally in a state of fair value, but if interest rates surge, the country is on the verge of a yellow light, which would immediately turn into a bubble. A balanced asset allocation is desirable. In contrast, in Japan, asset prices are undervalued even though it has been some time since the bottoming out after the burst of the bubble economy. The risk of investing in Japan is precisely the risk of not owning Japanese stocks. The “Ueda shock” and the “Ishiba shock,” the two policy shocks that dampened the sharp rise in stock prices since the beginning of this year, have abnormally increased the volatility of Japanese equities, further increasing their undervaluation (i.e., high risk premium). Japanese equities have continued to stray near their all-time highs due to pre-election uncertainty. However, unless a Constitutional Democratic Party of Japan (DPJ) government is formed, which has proposed a genuine deflationary policy of higher interest rates and fiscal austerity (unlikely), post-election buying of Japanese stocks is inevitable, and the Nikkei Stock Average will reach 42,000-45,000 yen within the year and 50,000 yen by early 2025.
Figure 1 Asset Price Cycles and Phases of Countries
Figure 2 TOPIX and SP500 multiples
(2) U.S. asset prices have momentum toward the formation of a bubble, but caution is advised
The U.S. asset price cycle may be at its most momentum-building toward bubble formation. Inflation fears have subsided, and recession worries have largely disappeared. Moreover, with plenty of room for interest rate cuts, this is a time when the rudder is likely to turn sharply in favor of risky asset investments. If Mr. Trump, with his market-friendly policies, becomes president, expectations may rise. And the election of Kamala Harris, who has swung sharply from the left to the center, saying “I am a capitalist,” would not dampen the market's soaring momentum.
Let us now examine the bubble level of the U.S. asset class. Stocks are not in a bubble, but they are no longer undervalued, and we are entering a phase where caution is warranted in the medium term. Figure 3 shows the Fed Model valuation as a quick guide. As of Friday, October 11, the SP500 yield was 4.39%, the 10-year Treasury yield was 4.07%, and the spread (≒equity risk premium) was 0.32%. The calculated fair value was 6226, almost the same as the actual stock price (closing price) of 5815.
While 10% profit growth is expected in 2025, if long-term interest rates jump to the 5% level, the spread (≒equity risk premium) will be negative for the first time since May 2002.
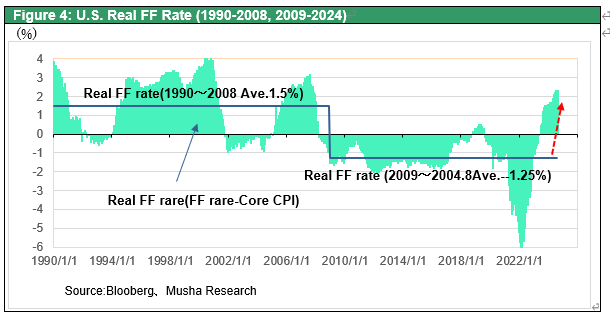
This strong appetite for risk-taking is also consistent with the sharp rise in the U.S. natural rate of interest (≒ real FF rate) as seen in Figure 4. Economic sentiment has fully recovered from the post-Lehman Brothers' collapse atrophy, and people are putting more emphasis on risk-taking. We are now in a situation in which a high interest rate (= brake) is necessary to achieve sustainable full employment growth.
Figure 3 Valuation of U.S. Equities from the Perspective of the Fed Model
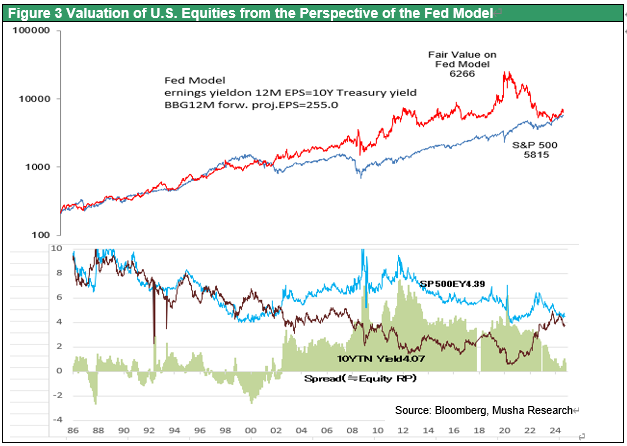
Figure4 Real FF Interest Rates and
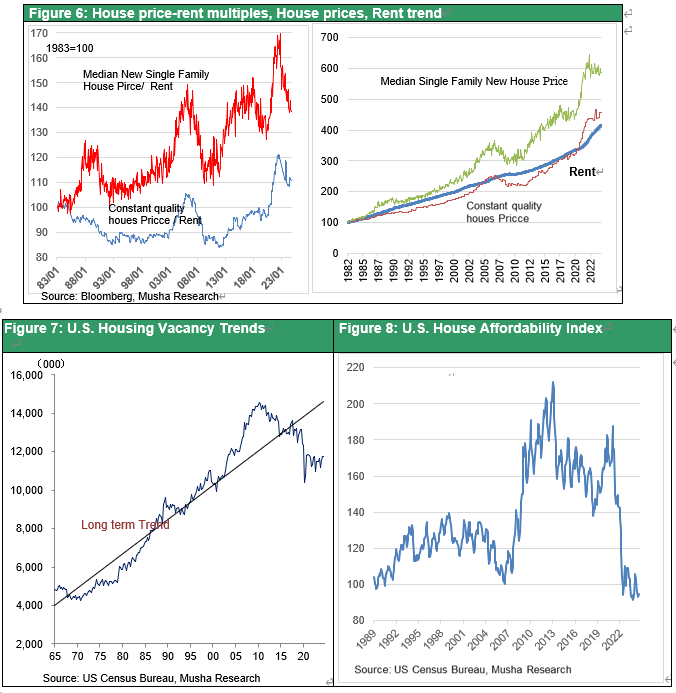
The same is true for housing, where asset prices are moving into overvalued territory. As shown in Figure 5, the Case-Shiller Home Price Index (2000=100) fell 27% from its peak (184) in 2006 to 134 in 2012, but rose to 308 in 2022, a 2.3-fold increase in 10 years. It then fell 5% at the beginning of 2023 but rose 10% in one year to 325 points in June 2024. Current levels are 77% higher than they were during the subprime housing bubble. However, housing prices that have soared above 2006 levels should not be immediately dismissed as a bubble. The following two factors should be taken into account: (1) an increase in the quality of homes sold and (2) an increase in rents (i.e., improvement in investment profitability). Nevertheless, while the constant quality based housing price-to-rent ratio, which takes both of these factors into account, has declined 10% from June 2022’s peak, the level is still higher than it was during the subprime housing bubble (see Figure 6). The U.S. housing market is in a perpetual state of short supply, as seen in the decline in vacant homes, and despite the fact that monetary tightening has made it harder to buy homes (see Figure 7), there is a structural problem in that prices have not fallen.
Figure 5Home Price Index, 20 U.S. Cities
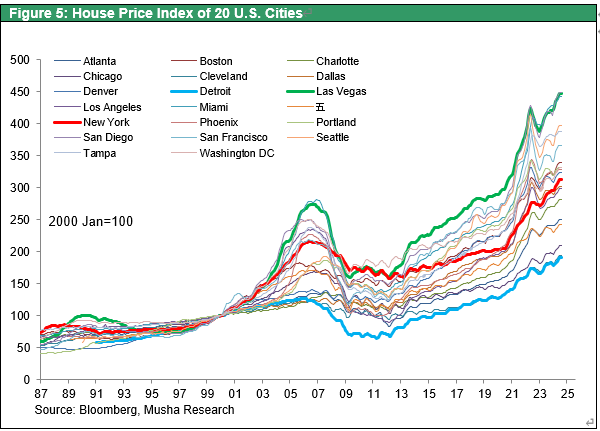
Figure 6Long-term trends in home price-rent multiples, home prices (median), home prices (homogeneous basis), and rents
Figure 7U.S. Housing Vacancy Trends
Figure 8U.S. House Affordability Index
As shown above, it appears that U.S. asset prices are on the verge of running toward a bubble. The real risk is when soaring asset prices can no longer be justified by a sharp rise in long-term U.S. interest rates. The entrenchment of the U.S. budget deficit is another factor driving interest rates higher. A shift of investment capital from stocks to bonds is about to occur in the US.
This risk is being contained by (1) ample domestic savings in the U.S. and (2) strong confidence in the Fed, both of which are keeping interest rates from soaring. This is likely the reason behind the rise in the U.S. neutral interest rate.
(3) China's Real Estate Bubble Will Have to Turn Toward Nationalization of Home Ownership
The collapse of China's real estate bubble is certain, and there is no prospect for its restoration. A series of stopgap measures will continue to be taken to create short-term stability. China's bubble is far more serious than Japan's, and the ultimate solution may be socialization (i.e., denial of individual ownership). Eventually, it will be essential to transfer the losses caused by the burst of the bubble to the government by injecting a huge amount of public funds of more than 50 trillion yuan (1,000 trillion yen) (see Note 1). (Note 1)
This is expected to help firms and households deal with losses and restore balance sheet health, but will the firms and banks that receive assistance then be able to revive themselves as capitalist entities? Without strict NPL disposal based on capital discipline (i.e., NPL assessment based on future cash flows) and financial structural reforms, economic agents will not be transformed and will simply become zombies. (Note 2)
(Note 1) How much will be the ultimate amount of non-performing loans in China? Based on (1) the 66 trillion yuan (=1,300 trillion yen) in outstanding debt of LGFVs(local governments financial vehicles) (2) accumulated household debt (2009-2022) of 10 trillion dollars (=70 trillion yuan), and (3) the inventory of unsold new home in China of 60 million units (estimated at 20 million yen per unit, or 1,200 trillion yen = 60 trillion yuan), even a rough estimate would amount to 1,000 trillion yen, or more than 50 trillion yuan. That is equivalent to about 50% of the 110 trillion yuan of GDP.
(Note 2) In the case of Japan, land prices have bottomed out after falling 80% from their peak. During this period, non-performing loans amounted to 100 trillion yen, or 20% of GDP, and the BOJ's balance sheet increased by 100 trillion yen from 50 trillion yen to 150 trillion yen during the period of financial NPL disposal (1996 to 2006), covering losses in the private sector. According to Minoru Kuwahara, this ¥100 trillion loss was covered by ¥38 trillion in public funds injected, consumption of unrealized gains on securities (peaking at ¥50 trillion in 1990), and the disposal of bank retained earnings. https://www.nippon.com/ja/in-depth/d00470/#
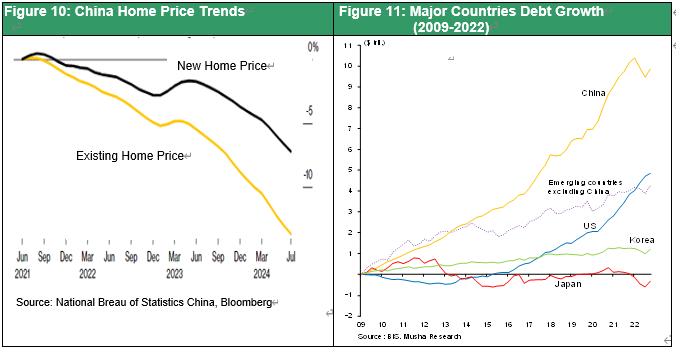
Housing prices in China have fallen only slightly less than 10% for new homes and less than 20% for existing homes. The decline has been limited so far due to price controls, but this has led to a sharp decline in transaction volume (-24.3% YoY from January to July this year, less than half the peak in 2021). Therefore, in terms of both statistics and corporate finances, there have been no bad loans on the scale that occurred in Japan. As a result, de facto bankrupt companies such as Evergrande Group and Country Garden Groupe are being kept alive through lending. Naturally, real estate transactions have plummeted due to the persistent negative view on housing prices for future.
In May, the government announced series of policies such as cut loan interest rates and down payment ratios to stimulate real estate demand, extended loans to real estate agents for the completion of uncompleted properties for which payment had already been received in advance, and bought up unsold housing stock and converted it into public housing. In October, it was announced that state-owned enterprises would be recapitalized through increased issuance of government bonds and support for the real estate industry, but the scale of this support appears to be far short of market expectations (2-10 trillion yuan (40-200 trillion yen)).
With rising job insecurity and a growing sense of uncertainty about the future of real estate prices, people are forced to cut back on consumption, which is causing further economic contraction. In China, where social insurance and pensions are not yet in place, savings are the only thing that ordinary people can rely on. In addition, 70% of China's personal assets are real estate, and it is said that 90% of Chinese people own their homes. When the bubble really bursts, the public sector will have no choice but to bear the losses of households.
Figure 9: Comparison of Housing Prices in Major Cities Worldwide, Annual Income Ratios, Rental Yields, and Purchasing Power-to-Price Ratios
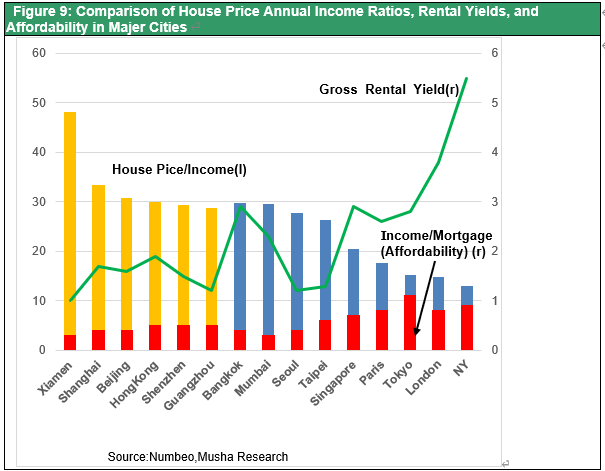
Figure 10China Housing Price Trends
Figure 11Major State Debt Growth (2009-2022)
(4) Japanese stocks, all investment entities will start buying at once
There is a Wall Street expression, “FOMO,” which stands for “Fear of Missing Out. I predict that the Japanese stock market is entering just such a state. People are finally realizing how ridiculously undervalued Japanese stocks are and are forced to seriously consider the risk of not owning Japanese stocks.
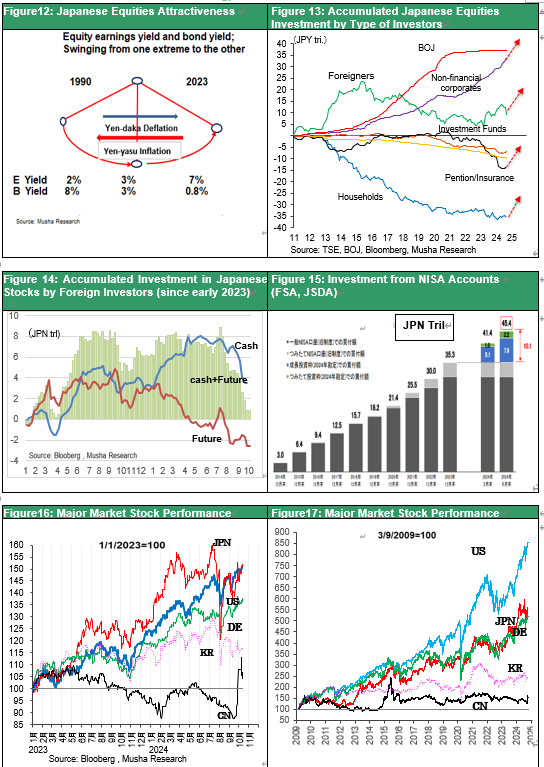
1) Foreign investors have not only increased their share of Japanese stocks, which have risen the most in the world's major markets since last year but have sold almost all of them. They will be forced to restore Japanese equity investment shortly (See Figure 14)
2) Individual investors ➡An investment boom is underway with the start of the NISA reform, with 10.1 trillion yen purchased in the January-June period of 2024. The annual amount will be 20 trillion yen, a fourfold increase from the previous year. For now, most of this is invested to foreign investment trusts, but there will be a rapid shift to Japanese equities.
3) Companies are buying back their own shares, pushed by the FSA and TSE, which require companies to correct P/B ratios below 1x.
4) Institutional investors such as pension funds ➡They are forced to reduce their investment ratio in JGBs and shift to stocks under the circumstances of persistent inflation and rising interest rates, and the government's request for more active investment in public pension funds such as KKR.
In this way, all investment entities will be pushed toward Japanese equities. There is no doubt that Japan's equity-based fund management system will begin to take off at a furious pace. Japanese equity investors will be reminded once again of FOMO, which was stalled by the Ueda and Ishiba shocks.
Figure 12: Overwhelming attractiveness of Japanese equities from a long-term asset cycle perspective
Figure 13: All investors face the risk of not holding Japanese equities
Figure 14: Accumulated Investment in Japanese Stocks by Foreign Investors (since early 2023)
Figure 15Buyouts from NISA accounts
Figure 16Major Country Stocks (Since Jan. 2023)
Figure 17Major Country Stocks (since 3/2009)
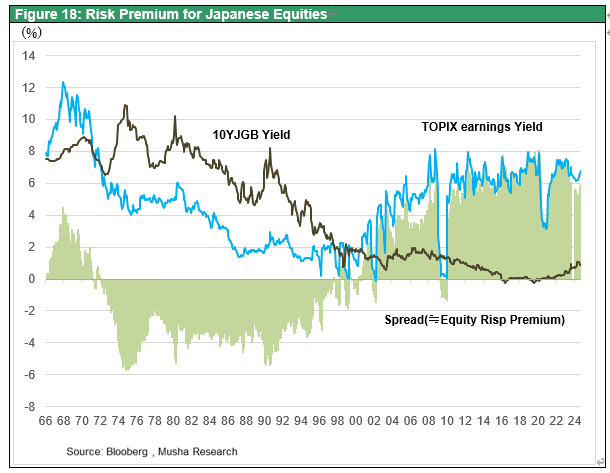
I would like to add two points that I think are important. First, the risk to Japanese equities is, first, premature monetary tightening. As shown in Figure 18, the risk premium for Japanese equities is significantly higher than that of the US. What this means is that, unlike in the U.S., the neutral interest rate in Japan remains remarkably low. A premature rate hike would be fatal. The lessons of the Ueda shock should be borne in mind. Secondly, the situation of US elevated interest rates level means that the yen will continue to depreciate. This is a factor that will boost Japanese equities.
Figure 18: Risk Prem